This page is intended as a platform to store and exchange modeling tools and data sets related to the Earth. This includes simulation and processing software, together with observational and virtual data coming primarily from seismology, tectonics, geodynamics and geodesy. In addition you will find relevant teaching material and publications for further information. Please use the navigation bar on the left side to retrieve models, related publications, teaching material and visualization tools.
Models
Animation of high resolution global geodynamic earth model. Colors denote temperatures (hot = red, cold = blue) with isosurfaces (-600 K and +400 K from the radial mean) showing major slabs and plumes. See figure below for details.
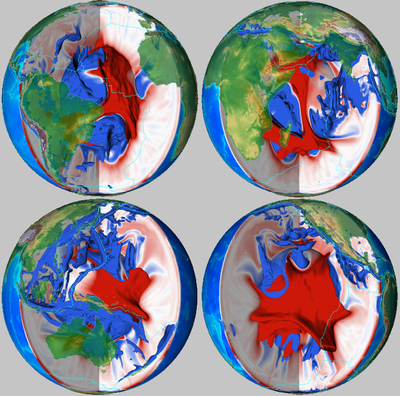
Three-dimensional representation of temperature variations in a geodynamic model with strong core heat flux. The four adjacent cross sections are centered on 35 (upper left), 125 (lower right), 215 (lower left) and 305 (upper right) degrees longitude. The color scale is saturated at -400 K and +400 K, and continents with color-coded topography and plate boundaries (cyan lines) are overlain for geographic reference. Isosurfaces of temperature are displayed for -600 K and +400 K. The +400 K isosurface is clipped in the uppermost 500 km to allow views into the mantle underneath the mid-ocean ridge system, which spans large parts of the oceanic upper mantle.